
AENAON SYNCRO CURRENCIES
Our flagship investment program implements a systematic trading process on a diversified basket of major currency pairs in the spot FX market. Prior to trade execution, our alpha discovery models utilize a variety of supervised and unsupervised Machine Learning algorithms to produce the most accurate forecasts possible.

16.46%
Annualized Performance
Annualized Performance expresses a strategy’s rate of return on an annual basis during the management period.

114.02%
Total Performance
Total Performance expresses the cumulative percentage increase or decrease in an account’s equity since the inception of the strategy.

$214,020
Investment Growth
This figure expresses the total growth of a hypothetical $100,000 investment in a managed account.

66.67%
Winning Months
The ratio of profitable months versus losing months, which describes how often the strategy generates profits or losses.

3months
Recovery Period Length
The number of months between a strategy’s maximum drawdown and its new peak equity value, measuring how quickly the strategy recovers from any losses.

-8.1%
Maximum Drawdown
The Maximum Drawdown figure measures the maximum percentage loss that the account has incurred from its highest to its lowest equity value at any point.
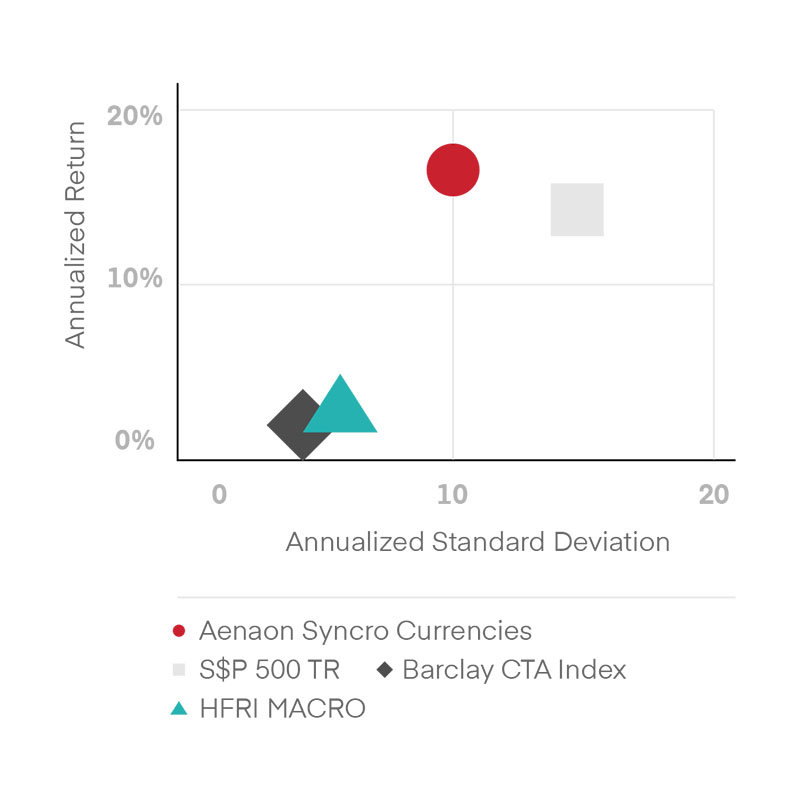
Risk/Return Comparison
The chart indicates the comparative performance of the strategy when compared to various industry benchmarks, discussing how well it performs against the mainstream markets.

1.59
Sharpe Ratio
This industry-standard metric provides an indication of a strategy’s returns relative to the risk of “staying in cash with 0% interest rate”.
10.05%
Annualized Volatility
Volatility is considered a measure of investment risk, as it describes how much the performance varies each month, from positive to negative territory.

-0.05
Correlation to S&P 500
Correlation is a measure of the degree to which two investments move in relation to each other. A value close to 0 is highly desirable as it offers the investor a much-desired diversification effect.


Time Window Analysis
This type of analysis breaks down the management period into shorter time-windows and describes the strategy’s performance during these segments.


Risk Rating
A low rating indicates an investment that assumes very little risk but also yields a very limited return while the opposite is true for a high rating. Generally speaking, investment risk and reward are tied together and a good balance between the two is highly desired.